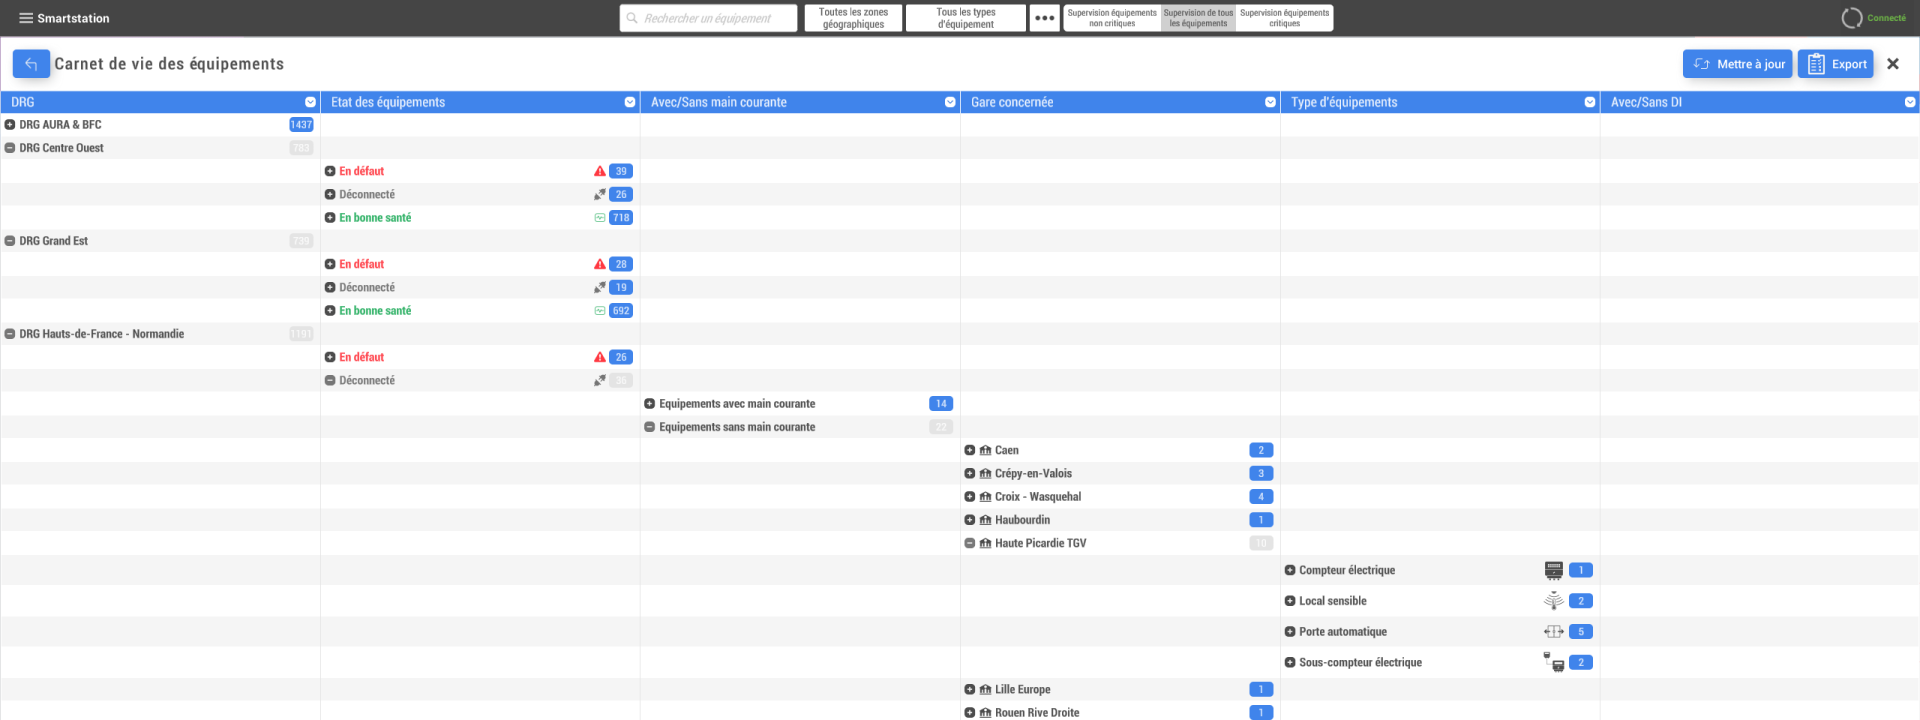
Turn your data into useful information.
Beholder links data from your systems to objects on the map. Every reading, status or alert gains context, helping you understand how the site operates and decide where to act.
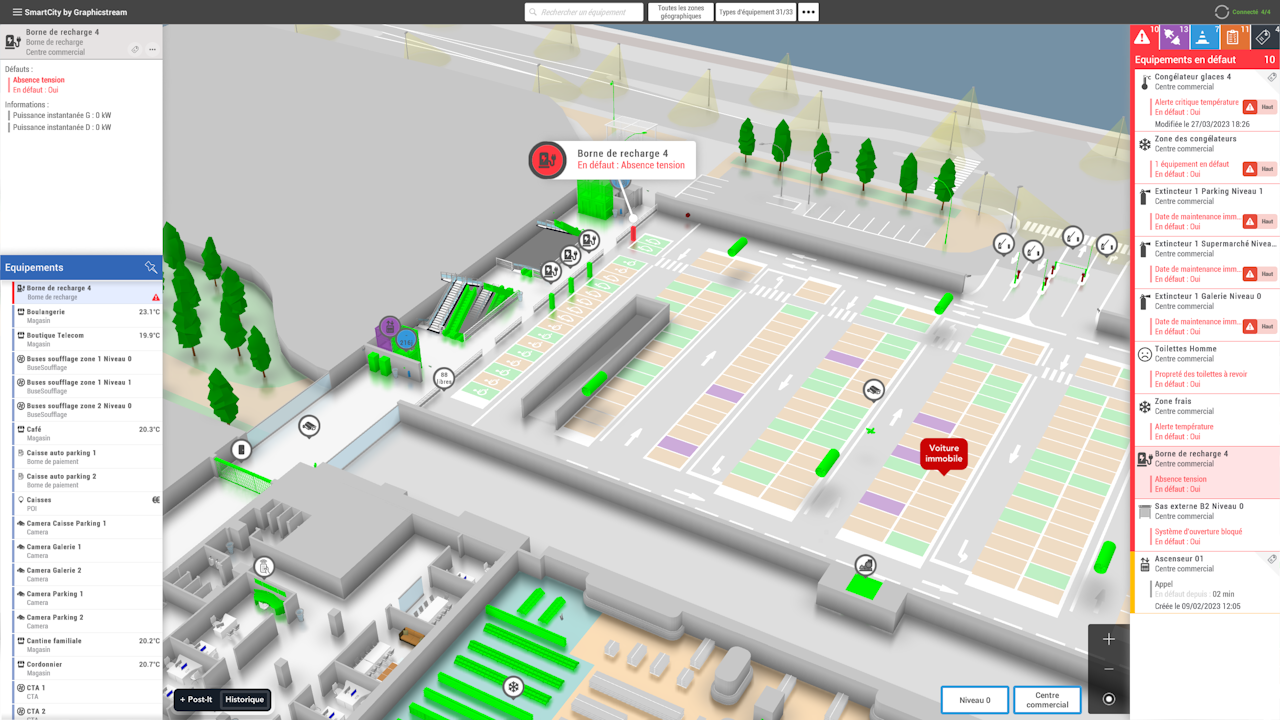
The map becomes a gateway to equipment data.
A digital twin connected to the state of your site.
The Hub supplies values from connected systems. The map presents a current view and, when historical recording is configured, lets you revisit a past situation. Available data, timestamps and update frequency provide the context for interpreting that view.
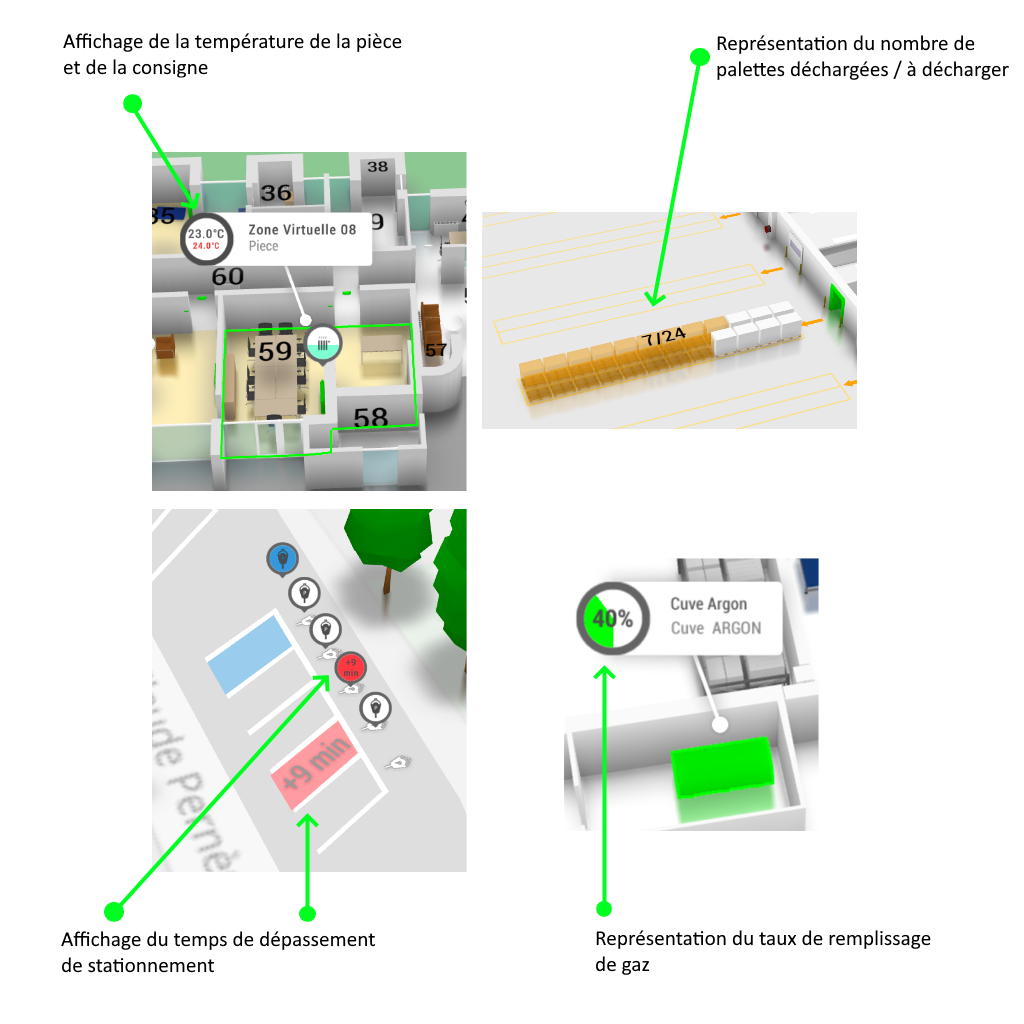
Read information where it matters.
Information cards on the 3D map associate equipment with its values, status and indicators. Visual and textual information connects the technical situation to its physical location.
A click or tap locates the equipment on the map and opens its details. Teams can move from an overview of system health to the object needing attention without losing the context of its location.
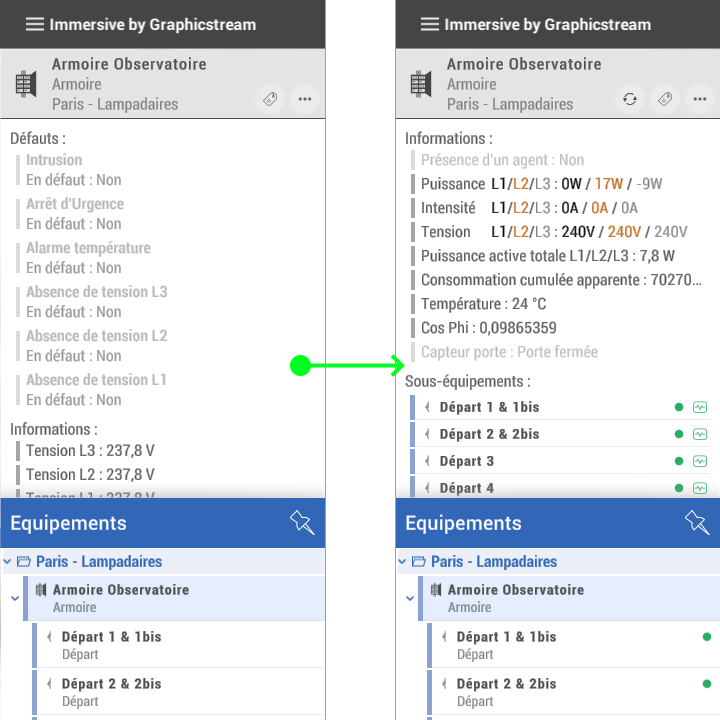
Adapt the display to your operations.
Choose which variables to show and define their labels, units, formatting and colours. The interface highlights information relevant to the task instead of presenting every value in the same way.
Scripting lets you adapt data interpretation and object behaviour: hide an unnecessary variable, change a representation according to its status or offer a specific action. These behaviours can be updated without reinstalling the client application.
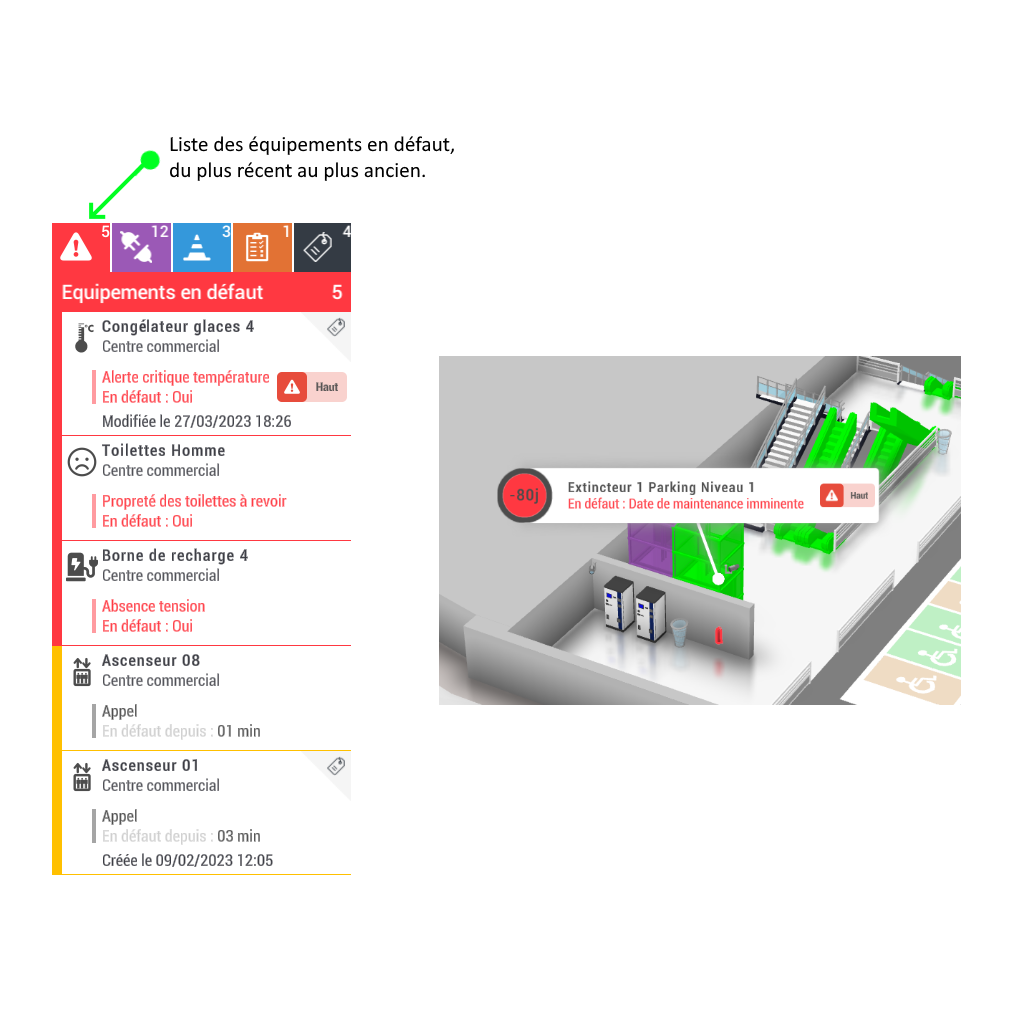
Detect, locate and track anomalies.
Define the business rules that trigger an alert and highlight equipment requiring attention. The map and lists provide the information needed to assess the situation.
Find faulty equipment with a click or tap, then track its handling using configurable maintenance states. Filters can, for example, distinguish issues already being handled from those still awaiting intervention.
See the bigger picture with reports.
Reports bring data together to provide a summary of system status. Equipment health, configurations or statistics: choose the presentation that suits your monitoring needs.
Export reports to Excel to continue your analysis or share them through your usual tools. Scripting lets you define additional reports and format data according to your own business rules.