Multiple sources. One way to access data.
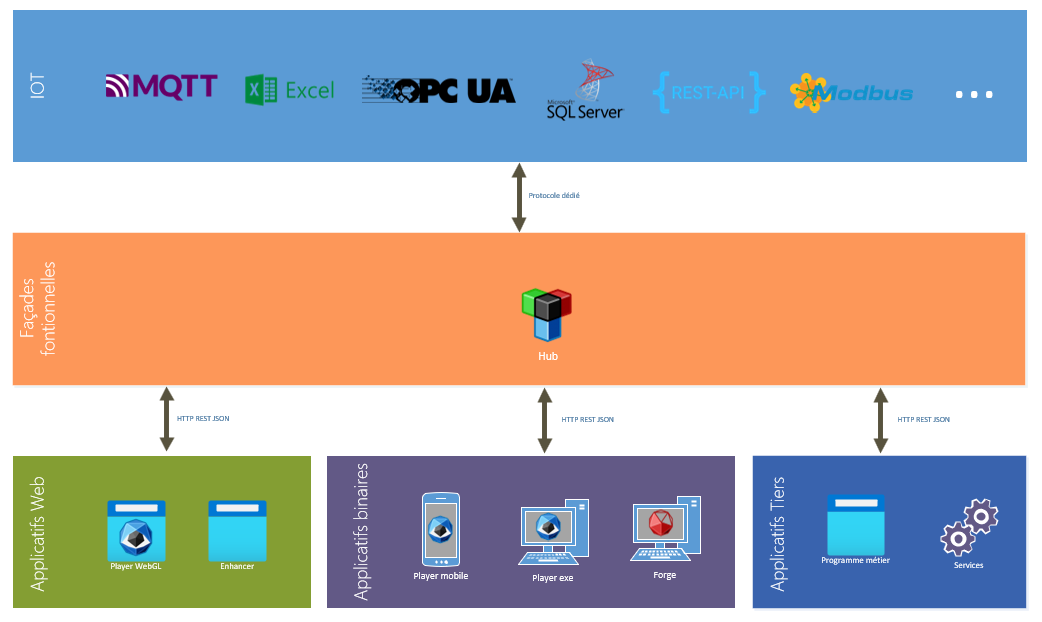
The Hub connects monitoring applications to the systems producing data. It delegates each access to a suitable connector, tracks value changes and makes them available to interested applications.
Understand the journey of a data value.
An application requests information for an asset. The Hub organizes collection and tracking, while connectors handle each source’s specifics. Beholder can therefore use data from different systems together.

Two interfaces, one service.
On the application side, a REST interface receives requests from monitoring tools, dashboards and business processes. On the field side, connectors access sources through their own protocols.
This separation lets a source or connector evolve without exposing its technical workings in every user interface. Exchanges are organized around requested data and its changes.
An architecture with distinct responsibilities.
Clients express their needs, the Hub coordinates requests and connectors communicate with sources. Three concepts structure this process: the handle, the session and the connector.
The handle: identify the data
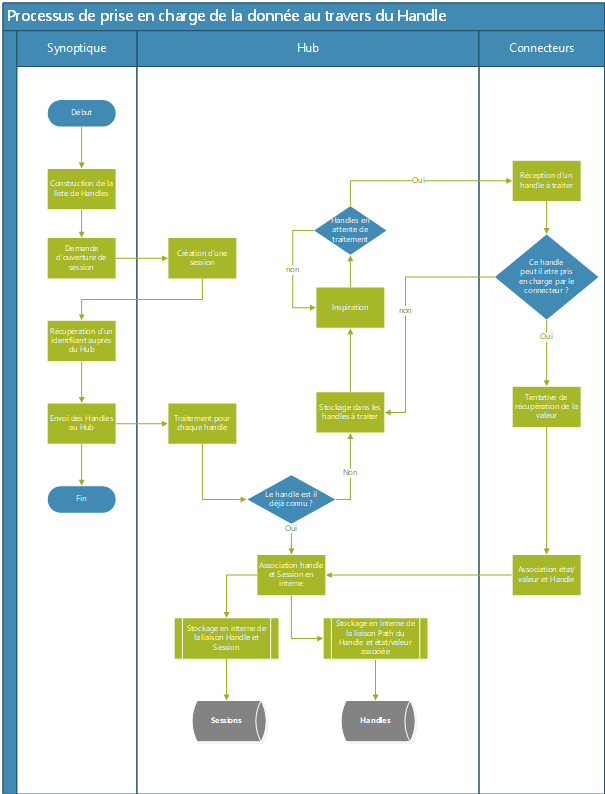
A handle describes access to a data item through a requester identifier, an access path and a value type, such as a number, text or Boolean. The path supplies the information needed to select a connector and reach the source.
The session: track a request
A session represents a data consumer. It registers relevant handles, retrieves their values and requests updates. Several sessions can follow the same source without implementing protocol logic in each client.
The connector: access the source
A connector communicates with a specific protocol or system. It acquires values, reports their status and informs the Hub of changes according to the source’s capabilities.
One sensor, three values, two sources.
Consider a temperature sensor: its current reading and operating thresholds may come from different systems. The Hub brings them together for the application using them.
The current reading
One handle targets the temperature exposed by an OPC UA server.
The expected thresholds
Two other handles can target Excel cells holding minimum and maximum thresholds, depending on the deployed connector.
Tracking changes
A new reading or changed threshold becomes available to interested sessions according to each source’s acquisition method and frequency.

Connect different protocols and formats.
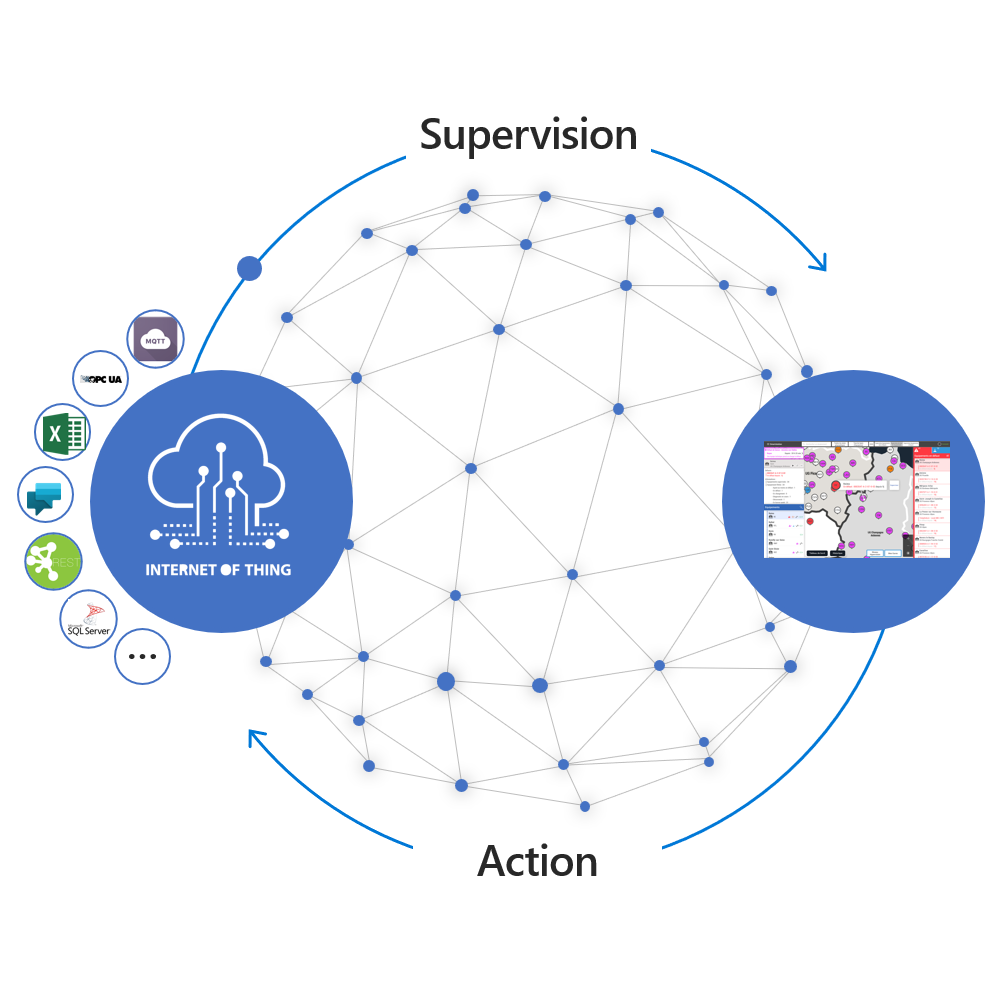
Connectors cover sources such as OPC UA, MQTT, Modbus, REST services, SQL databases, and Excel or CSV files. Actual capabilities depend on installed connectors and their configuration.
A handle’s path describes the requested data. A compatible connector handles access while the client continues using the Hub’s common interface.
From a session to an updated value.
The client opens a session and submits its handles. If a path is already tracked, the Hub associates the new request and the known value. Otherwise it looks for an available, compatible connector. Acquisition produces a value, status and timestamp; updates are then made available to interested sessions. Unsupported access remains pending a suitable connector, while the data status indicates the acquisition result.
Extend connectivity with plugins.
A connector adds knowledge of a protocol or business API to the Hub. Extend existing connectivity to access a system specific to your environment.
The extension preserves the shared handle and session model. The monitoring application keeps requesting the information it needs without directly integrating each protocol.
Develop a connector in .NET.
Developers use the Hub’s libraries and programming contracts to implement a connector. The .NET ecosystem and Visual Studio provide tools for communicating with the target systems.
The connector handles access to values and changes, together with connection states and errors. Integration is validated against the project’s data, network constraints and use cases.
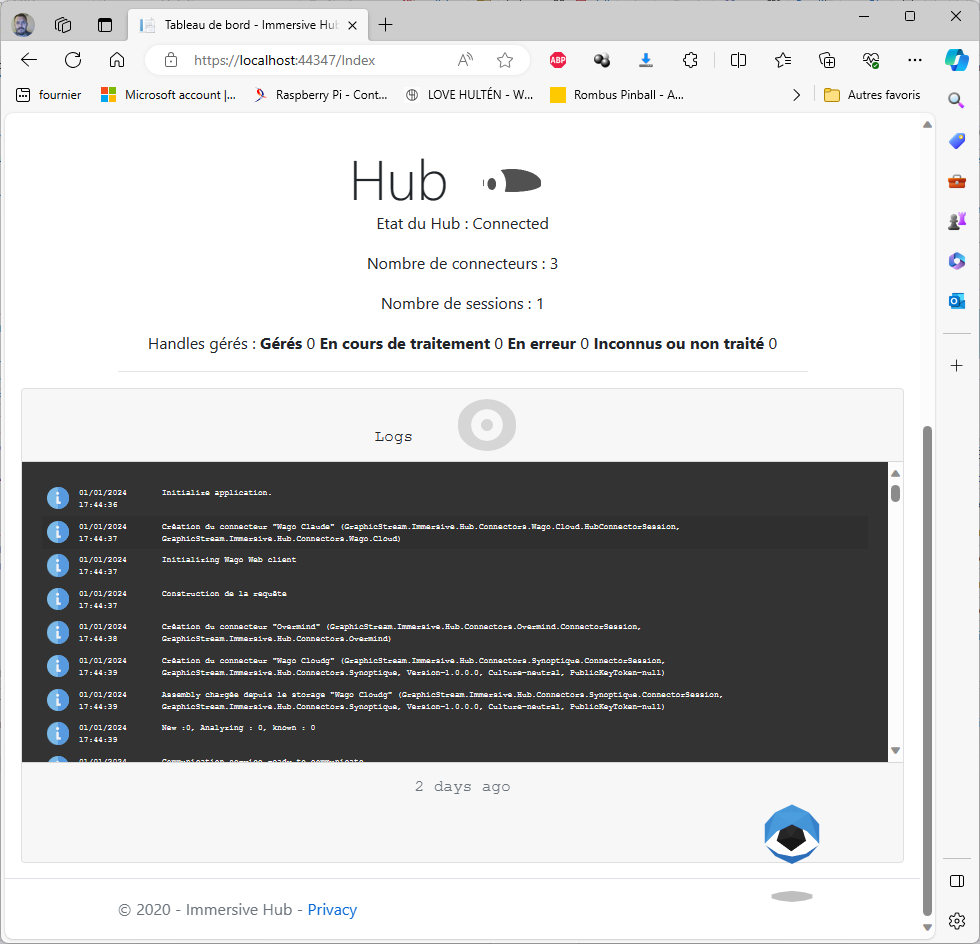
Administration through a Web interface.
The administration interface brings together connectors, sessions and handles. It lets you inspect managed data and understand relationships between consumers and sources.
This view supports configuration and troubleshooting: identify a session, check data handling and examine connection states. Access is organized according to deployment and administration responsibilities.
Keep a history of values and states.
When historical recording is configured, values and their states can be saved to SQL storage, on your infrastructure or in the cloud according to the chosen architecture.
This data can support reviewing a past situation in Beholder where the scenario allows it, as well as external analysis and reporting. Collection frequency and retention should follow business needs.
Your next project starts here.
Move from discovery to hands-on learning with the Developer Network. Find technical articles, tutorials and resources to create maps, connect equipment and customise Immersive.
Connect your field systems to your applications.
Identify your data sources, required connectors and update conditions to build monitoring suited to your environment.