Scripting: Scripting debug
- Tutorial
Tutorial
This chapter describes the tools available to identify, analyze, and remediate errors that may occur when running scripts in the Beholder. It presents the debug console as well as the list of behaviors.
When writing a script or running it, it's not uncommon for a syntax error or programming occurs and the script crashes.
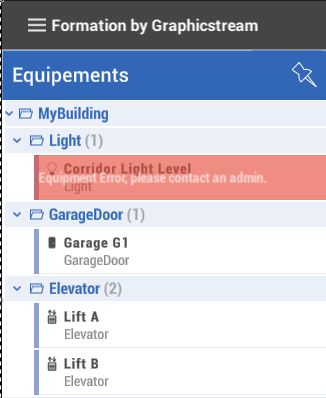
In this case, the failed equipment will appear entirely in red in the list on the left As in the following example:
In order to recover a more accurate error, there are 2 ways:
- Open the debug console
- See the error in the list of behaviors.
Debug console
To access the console, you have to click 5 times quickly in the top left corner of the application.
A keyboard appears and you have to enter the code: 1337
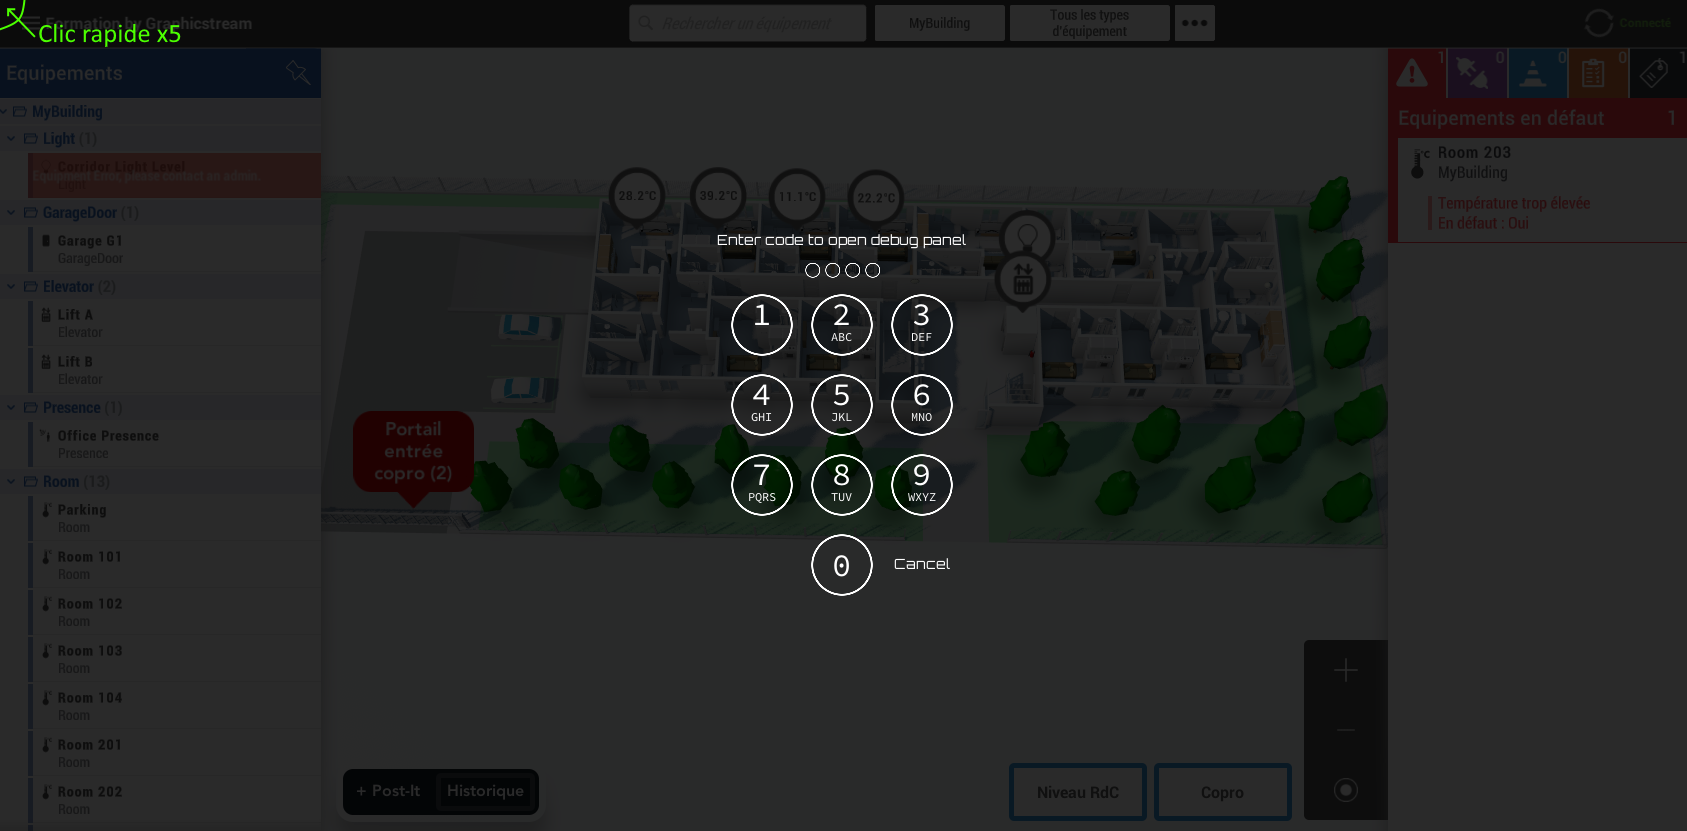
The debug console is an advanced tool for analyzing internal behavior of the application when running scripts.
The Console lists all the logs of the application, including errors. By choosing an error, its detail appears and it should help find the error in its script.
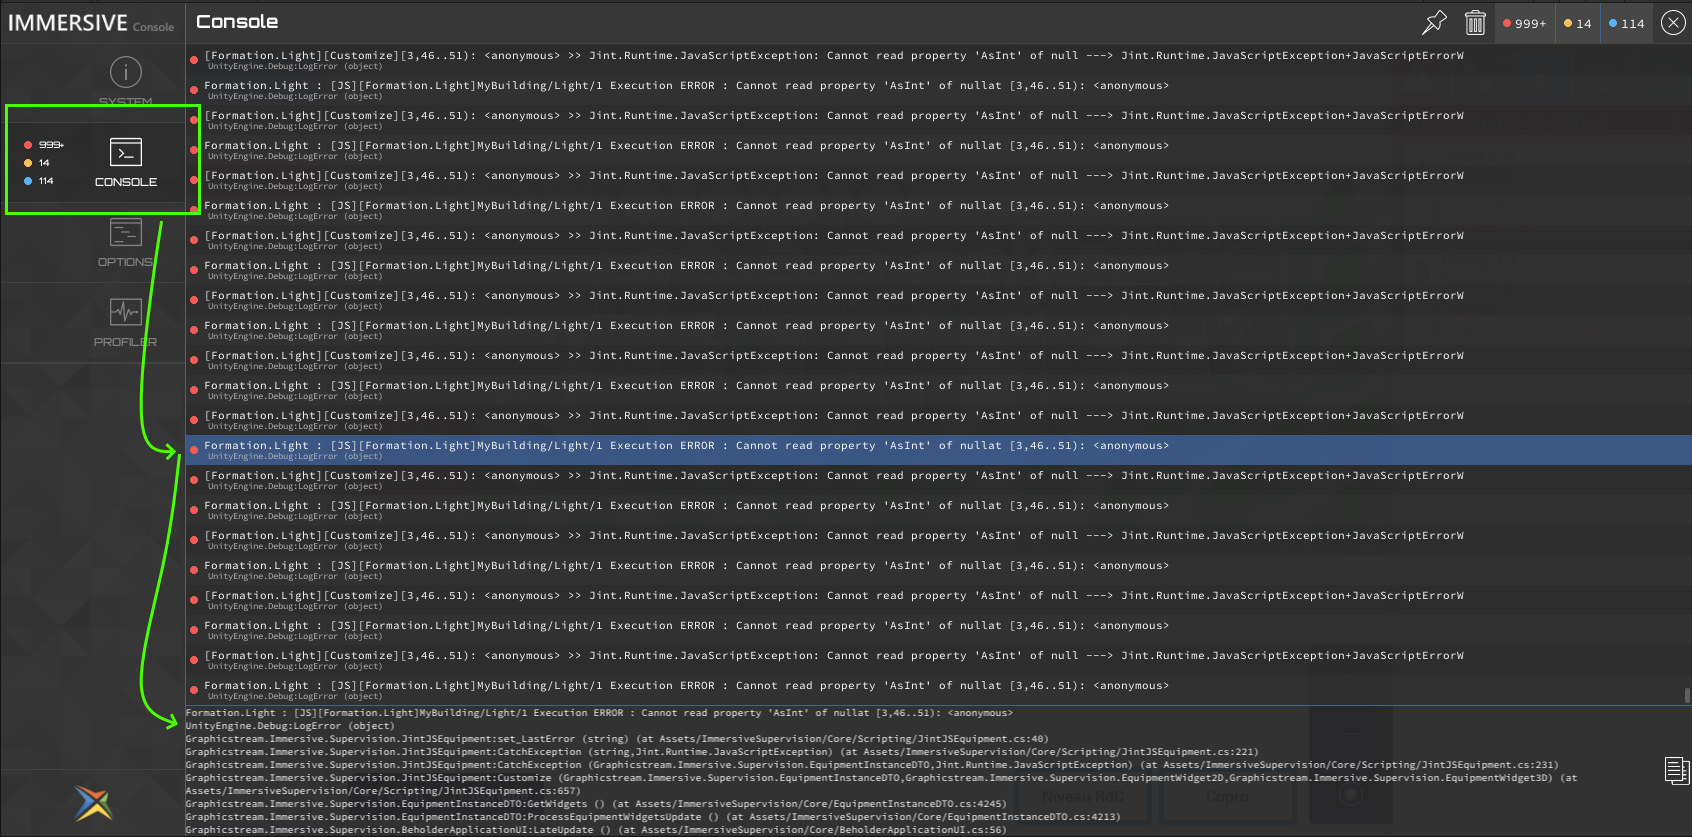
In our example, the following error is thrown:
Formation.Light : [JS][Formation.Light]MyBuilding/Light/1 Execution ERROR : Cannot read property 'AsInt' of null
at [3,46..51): <anonymous>
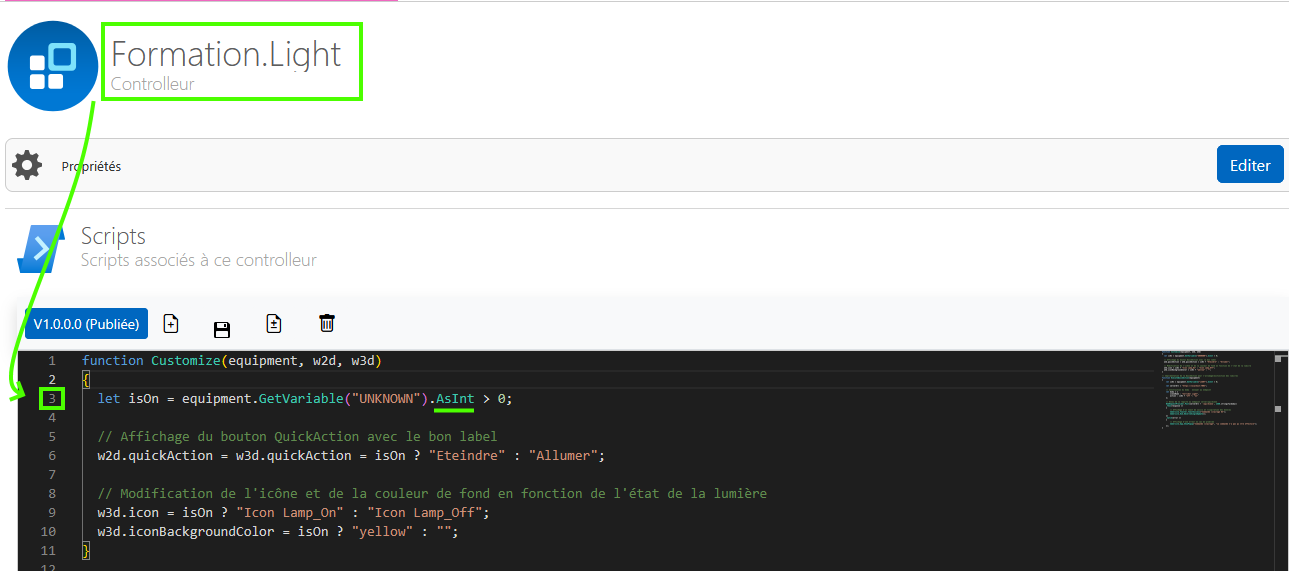
- Script Name:
Formation.Light - Incorrect Equipment Name:
MyBuilding/Light/1 - Error line:
3(to character 46)
By examining the script, the error is easily corrected.
The device has no id variables UNKNOWN
and crashes when trying to call a property on the null.
List of behaviours
By accessing the burger menu in the top bar and then "List of Behaviours", A window displays all the scripts present in the application.
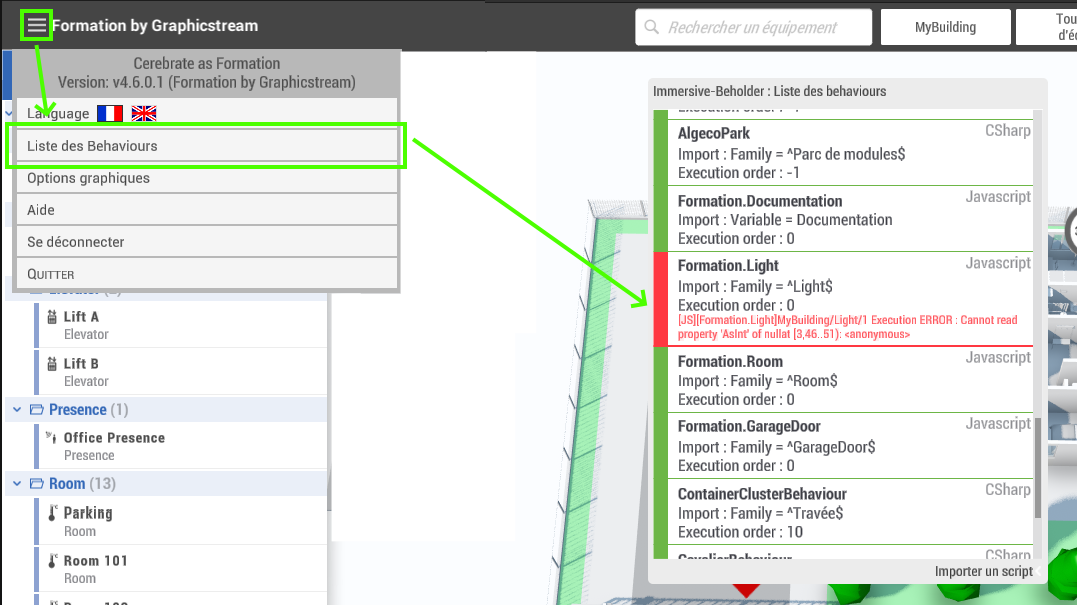
Scripts in error are displayed in red with the error details.